To P2P, or not to P2P? That is the question…

21.4.2020

In the wake of the completing of the National Veterinary Care sale to VetPartners, we thought it would be interesting to present a summary of P2P transactions in Australia over the last 2 years, and see what the data tells us about P2P. P2P simply means the takeover of a listed (public) company so that it then becomes a private company, either independently (typically with the backing of a financial sponsor) or as part of a larger company (ie. a strategic buyer).

Over the last 2 years in Australia, 56 listed companies have been the subject of public to private (P2P) takeover attempts.

Of the 56 P2Ps in the last 2 years:

  • 19 have been from international strategic investors, eg. DuluxGroup (Nippon Paint – Japan), GBST Holdings (FNZ Group – UK), Ruralco (Nutrien – Canada), Bellamys Australia (China Mengniu Dairy – China), ERM Power (Shell – Netherlands);
  • 15 have been from International private equity investors, eg. MYOB (KKR), Scottish Pacific (Affinity Equity Partners), Greencross Vets (TPG);
  • 11 have been from Australian strategic investors, eg. Fairfax Media (Nine Entertainment), Xenith IP (IPH), Chalmers (Qube Logistics); and
  • 11 have been from Australian private equity investors, eg. Navitas (BGH consortium), and Zenitas Healthcare (Adamantem).

Given the number of transactions that have occurred, we decided to run the numbers to see what premiums are being paid, and the factors that influence this premium.

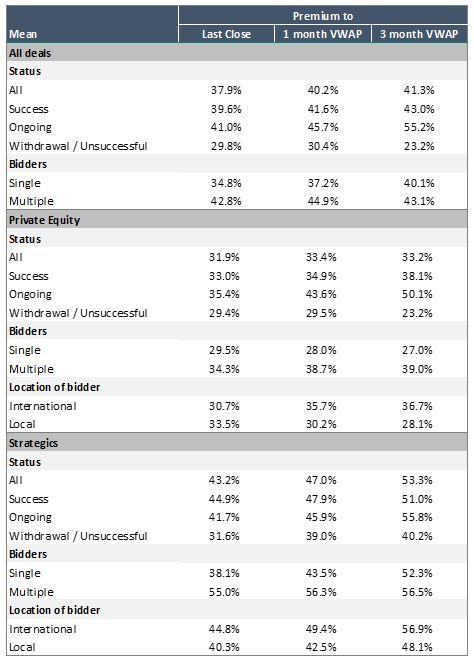
Focusing on the takeover price compared to the 3-month VWAP (Volume Weighted Average Price):

  • The average premium across all transactions was 41%;
  • The average for strategic investors was 53%, compared to 33% for PE deals;
  • The average for successful deals was 43%, compared to 23% for unsuccessful deals;
  • Where a strategic investor was involved, the average premium paid by international investors was 57%, compared to 48% for local buyers;
  • The average where there were multiple bidders was 43%, compared to 40% where there was only one bidder.

The summarised data is presented in the following table.

These conclusions confirm what you would expect, and highlight that there can be a substantial difference in the price paid depending on the nature of the investor. Listed takeover targets can’t always control their fate, but they can control their preparation. We recommend always having a defence pack ready, and a plan for how to engage the bidders most likely to pay a strategic premium.

27.2.2026

Sector dashboards February 2026

Our monthly sector dashboards are out! Our dashboards look at the valuation multiples across seven key sectors, each made up of a number of subsectors. The data takes into account the sale prices of similar companies based on; products, end markets, services, assets classes or other characteristics. The publications include all companies listed on the […]

Read more
27.2.2026

On the floor at EvokeAg 2026: Luke Harwood’s reflections on Australian Agtech

EvokeAg 2026 drew over 1,500 delegates from 18 countries to Melbourne in February, with the Federal Government committing another $450,000 to support the event over the next three years. The visible momentum is real, and the cohort of companies I spent two days meeting reflected it. Most were past proof-of-concept by a meaningful margin, with […]

Read more
27.2.2026

Australian mining industry: Outlook, drivers and opportunities for METS companies

The Australian mining industry enters 2026 with a constructive, albeit moderating, outlook shaped by global economic conditions and the structural shift toward decarbonisation. The Australian Government’s Office of the Chief Economist, in its latest Resources and Energy Quarterly, notes that commodity prices are generally expected to ease from recent highs but remain supportive of continued […]

Read more
28.1.2026

Sector dashboards January 2026

Our monthly sector dashboards are out! Our dashboards look at the valuation multiples across seven key sectors, each made up of a number of subsectors. The data takes into account the sale prices of similar companies based on; products, end markets, services, assets classes or other characteristics. The publications include all companies listed on the […]

Read more
27.1.2026

What has 2025 taught us about APAC M&A and what comes next in 2026?

As we kick off the new year, we went around the InterFinancial team and asked a simple question: What did you see in the APAC M&A market in 2025, and what does it mean for 2026?  The answers were candid, thoughtful and in some cases, refreshingly blunt. While the headlines were dominated by AI hype, geopolitical noise and regulatory change, the […]

Read more
16.12.2025

Sector dashboards December 2025

Our monthly sector dashboards are out! Our dashboards look at the valuation multiples across seven key sectors, each made up of a number of subsectors. The data takes into account the sale prices of similar companies based on; products, end markets, services, assets classes or other characteristics. The publications include all companies listed on the […]

Read more
27.11.2025

Sector dashboards November 2025

Our monthly sector dashboards are out! Our dashboards look at the valuation multiples across seven key sectors, each made up of a number of subsectors. The data takes into account the sale prices of similar companies based on; products, end markets, services, assets classes or other characteristics. The publications include all companies listed on the […]

Read more
27.11.2025

APAC Tech M&A: What Q3 trends mean for Aussie sellers? 

MergerMarket and DataSite have released their Asia Pacific Q3 M&A report and it’s full of insights for technology founders thinking about an exit in the next few years. While activity has slowed from previous highs, tech is still the most active sector across the region, and the pipeline of companies preparing for sale remains deep. […]

Read more
28.10.2025

Sector dashboards October 2025

Our monthly sector dashboards are out! Our dashboards look at the valuation multiples across seven key sectors, each made up of a number of subsectors. The data takes into account the sale prices of similar companies based on; products, end markets, services, assets classes or other characteristics. The publications include all companies listed on the […]

Read more