Everyone’s going private: current status of the P2P landscape
27.8.2024A few years ago, we ran some analysis on Public to Private (P2P) transactions to see what we could distil from the data. You can read the article here.
P2P or Take-Private simply means the takeover of a listed (public) company so that it then becomes a private company, either independently (typically with the backing of a financial sponsor) or as part of a larger company (i.e., a strategic buyer).
Given it has been a good five years and P2Ps have been all the rage lately, we decided to run the numbers again and see what trends we could discern.
We reviewed 275 transactions since 2019 covering International & Local bidders, Strategic and PE buyers, Successful and Unsuccessful bids, via Scheme or Takeover, covering all sectors on the ASX.
So, what are the key messages?
- 30% is about right when value is fully reflected in the share price. As a general rule, an approximate 30% premium is about what you would expect to pay for control of a fairly valued stock when the bidder has no strategic levers they can pull. In 2021, we saw very full valuations across the market driven by low interest rates and strong economic activity. At this point, premiums were as close to 30% as we’ve seen even with many a strategic deal occurring.
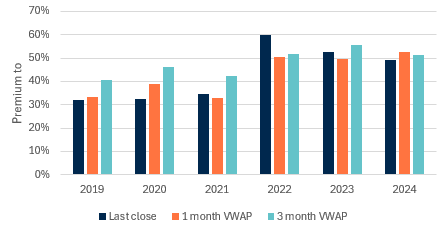
- As valuations have declined, premiums have increased. We saw valuations peak in 2021 with the bottoming out of interest rates. Once those rates reversed, valuations contracted with the general outlook on earnings also softening. It is clear that Boards have taken the view that adding a 30% control premium to the current trading price isn’t reflective of the long–term value of their business and are demanding a stronger premium.
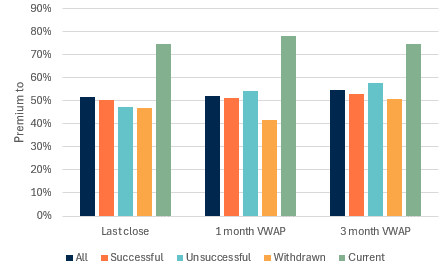
- Current premiums are very strong. On average, premiums reduce when comparing successful deals, to unsuccessful or withdrawn deals (Successful trumps unsuccessful – makes sense). However, streaking well ahead were the 18 deals currently in play which are significantly above the group average. Perhaps the combination of depressed valuations with a clearer line of sight to interest rate decreases have enabled current bidders to be more bullish. Expect a few more companies to leave the bourse in the next year.
- Expect stronger value in a Scheme. Premiums under a Scheme of Arrangement process were on average; 55%*, whereas under a Takeover Bid; 45%. Given a Scheme is friendly and for 100% of the business, whereas Takeovers can be more opportunistic and hostile at times, it makes sense that on average there is a meaningful difference.
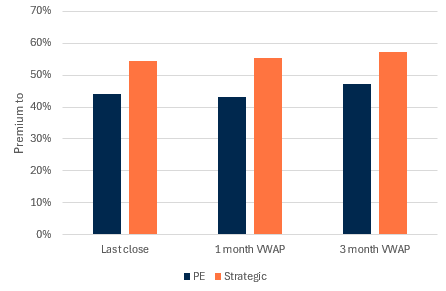
- Strategic and International bidders have the edge on value. Given they have more levers to pull, it is unsurprising that Strategic buyers (56% premium) are able to pay greater premiums than PE investors (45% premium). In a similar vein, International bidders (58% premium) historically have paid higher than the Locals (48% premium).
- Tech premiums outperform other sectors. More than any other sector, premiums in Software have outperformed all other sectors (at 69% versus 53%). Looking closer at the data, aggressive premiums have been largely since 2022 when we saw valuations in tech drop further than other sectors. It seems that Bidders are identifying bargains in the tech space, banking on a valuation returning to the mean over time.
These conclusions confirm what you would expect and highlight that there can be a substantial difference in the price paid depending on the nature of the investor. Listed takeover targets can’t always control their fate, but they can control their preparation. We recommend always having a defence pack ready, and a plan for how to engage the bidders most likely to pay a strategic premium.
For expert guidance on creating a defence pack, contact our experienced Director, Michael Kakanis for a confidential discussion.
*where a single figure is used, data is average across Last close, 1 month VWAP and 3 month VWAP.